Chapter 2a: Importance of Practicing Environmental Sustainability in All Countries
“Research shows that showing people research doesn’t work.”
– Prof. John Sterman, MIT Sloan
Objectives
By the end of this chapter, students will be able to:
- Explain how human activities affect global surface temperatures.
- Describe the phenomenon of global warming and its impacts on weather patterns.
- Analyze the relationship between greenhouse gas emissions and global warming.
- Discuss the goals and mechanisms of the Paris Agreement.
- Evaluate the social and economic implications of climate change and mitigation efforts.
Introduction
Cultural differences significantly influence how sustainability messages are conveyed and perceived in different countries. Cultural norms and values shape the techniques and channels used, making it essential for businesses to tailor their sustainability communications to resonate effectively with diverse audiences worldwide. In order to analyze our own messages for effectiveness, it is essential to explore groups of countries, compare how they rank in terms of sustainability efforts, then preview how governments regulate businesses’ impact on the planet.
Businesses and governments communicate messages to their stakeholders that can be confusing—such as whether or not climate change is driven primarily by human activities, has a profound impact on the Earth’s radiative balance, and is raising global temperatures. One concept to clarify primarily is climate change. Climate change is a long-term change in the average weather patterns that to define Earth’s local, regional, and global climates. Global warming is the long-term heating of Earth’s surface, not to be confused with weather (temporary changes in temperature) or climate change (30 or more years of change in temperature). Scientists observed the Earth’s surface increasing in temperature in the pre-industrial period (between 1850 and 1900) due to human activities, primarily fossil fuel burning, which increases heat-trapping greenhouse gas levels in Earth’s atmosphere.[1]
Climate change leads to various environmental, social, and economic consequences that require urgent international cooperation and policy intervention, but not all countries agree on actions to take, if any. This chapter will lay foundation for scientific concepts surrounding business sustainability, how different countries respond differently to these concepts, and how we can handle the discomfort in discussing climate change.
The Science of Climate Change
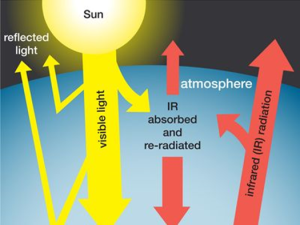
A greenhouse gas is a kind of gas that can absorb infrared radiation, which is the net thermal energy released from the Earth’s surface. It then re-emits this radiation back towards the Earth’s surface, so adding to the greenhouse effect. Carbon dioxide, methane, and water vapor are the primary greenhouse gases. (Additionally, surface-level ozone, nitrous oxides, and fluorinated gases have a limited capacity to capture infrared light.) Despite constituting just a small portion of total atmospheric gases, greenhouse gases significantly impact the energy balance of the Earth system. The levels of greenhouse gases have significantly fluctuated over the history of the Earth, and these fluctuations have caused significant changes in the climate throughout a broad variety of time periods. Typically, the levels of greenhouse gases have been notably elevated during times of warmth and reduced during periods of cold.
Greenhouse gases—i.e., gases such as carbon dioxide and methane that absorb heat energy emitted from Earth’s surface and reradiate it back—generated by industry and transportation cause the atmosphere to retain more heat, which increases temperatures and alters precipitation patterns. Human activities, particularly the increase in greenhouse gases like carbon dioxide and methane, alter the Earth’s radiative balance. These gases trap heat in the atmosphere, causing global temperatures to rise and precipitation patterns to change.
The greenhouse effect refers to the phenomenon of Earth’s surface and troposphere, the lowest layer of the atmosphere, being warmed due to the presence of water vapor, carbon dioxide, methane, and other specific gases in the air. Among the gases referred to be greenhouse gases, water vapor has the most significant impact.
What is Global Warming? What causes it?
During the Industrial Revolution to the conclusion of the 20th century, there was a notable rise of around 30 percent in the concentration of carbon dioxide in the Earth’s atmosphere. In fact, the amount of methane more than doubled during this time. Several experts have forecasted that the rise in atmospheric carbon dioxide and other greenhouse gases caused by human activities may result in a worldwide average temperature increase of 3-4 °C (5.4-7.2 °F) by the end of the 21st century, compared to the average temperature between 1986 and 2005. The phenomenon of global warming has the potential to significantly change the Earth’s climates, leading to a rise of unusual patterns and intensities of drought and rainfall. Consequently, it may impair food production and availability of water in certain locations.[2] Global warming has been linked to the frequency of severe and extreme weather, massive floods, and wildfires. These occurrences pose a hazard to human infrastructure such as houses, dams, and transportation networks. [3]
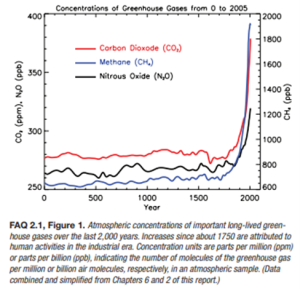
Lack of food, water, and other essential resources impact businesses, economies, and relations between countries intranationally and internationally. Below is a chart of the Earth’s surface temperature anomaly increasing since 1880 but especially since 1990:
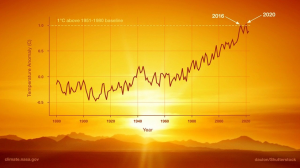
While science attributes global warming to human activity, the specific origins may be seen in the figures provided below. First, it is essential to define fossil fuels and the primary greenhouse gases released by human activity on a worldwide level to understand this chart.
Fossil fuels mean energy sources, including oil, coal, and natural gas. These non-renewable resources formed when prehistoric plants and animals died and eventually were buried by layers of rock. Over millions of years, different types of fossil fuels have formed.[4] Burning fossil fuels releases stored carbon into the atmosphere, including the most common greenhouse gases below.
- Carbon dioxide (CO2): The main origin of CO2 is the combustion of fossil fuels. Carbon dioxide (CO2) may also be released into the atmosphere from the landscape as a result of deforestation, land clearing for agriculture or construction, and soil deterioration. In addition, land management practices may effectively mitigate the presence of excess CO2 in the atmosphere by implementing reforestation initiatives, enhancing soil health, and doing many other activities.
- Methane (CH4) emissions are caused by agricultural operations, waste management, energy generation and usage, and biomass burning.
- Nitrous oxide (N2O) emissions mostly come from agricultural operations, including the usage of fertilizers. Nitrous oxide is also produced by chemical synthesis and the burning of fossil fuels.
- Fluorinated gases, such as hydrofluorocarbons (HFCs), perfluorocarbons (PFCs), and sulfur hexafluoride (SF6), are emitted into the atmosphere as a result of industrial activities, refrigeration, and the usage of various consumer items.[5]
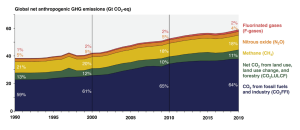
Below is a chart showing how much each type of gas described above has been increasing over the years, with CO2 from fossil fuels and industry increasing the most from 1990-2019.
The three top toxic gases and where they are being distributed can be seen in the chart below. CO2 is the largest being spread to land-based production, transportation, and LULUC.
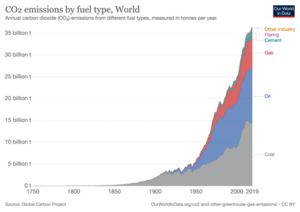
Above is a chart that shows an increase in the use of coal from 1750-2019. As coal rose around 1850-2019, the highest amount of CO2 emissions released in the most recent years. Oil and gas increased above coal.Also watch this video to learn how the amount of carbon dioxide in Earth’s atmosphere has changed over time with data visualizations and video. Use these resources to analyze the relationship between atmospheric CO2 and Earth’s temperature and to make an evidence-based claim that humans have impacted the level of atmospheric CO2. One more visual is below:
Where do these gases come from? The EPA traces most of it to the following:
- Electricity and heat production accounted for 34% of global greenhouse gas emissions in 2019. This is mostly due to the combustion of coal, natural gas, and oil for the purpose of generating electricity and heat. It is the greatest contributor to greenhouse gas emissions worldwide.
- Industry, which accounts for 24% of global greenhouse gas emissions in 2019, mostly comes from the combustion of fossil fuels at facilities for energy production. This sector include emissions resulting from chemical, metallurgical, and mineral transformation operations that are not linked to energy use, as well as emissions from activities related to waste management. (Note: Emissions resulting from the use of electricity in industrial processes are not included in this category and are instead accounted for in the Electricity and Heat Production sector.)
- Agriculture, Forestry, and Other Land Use (22% of 2019 worldwide greenhouse gas emissions): Agricultural activities such as crop cultivation and animal farming, as well as deforestation, contribute a significant amount of greenhouse gases. This estimate excludes the amount of CO2 that ecosystems extract from the atmosphere via the process of sequestering carbon, such as in biomass and soils.
- Transportation, which accounts for 15% of global greenhouse gas emissions in 2019, mostly comes from the combustion of fossil fuels in road, rail, air, and marine transportation. The majority (95%) of global transportation energy is derived from petroleum-based fuels, mostly gasoline and diesel.
- Buildings contribute approximately 6% of global greenhouse gas emissions in 2019. These emissions result from the use of energy on-site and the burning of fuels for heating and culinary purposes in buildings and houses. It should be noted that when electricity usage in buildings is included in this sector instead of the Energy sector, emissions from this sector account for 16%.
The following pie chart represents the distribution of greenhouse gas emissions by economic sector on a global scale, although the percentages are somewhat different because “other” makes up 10% of it:
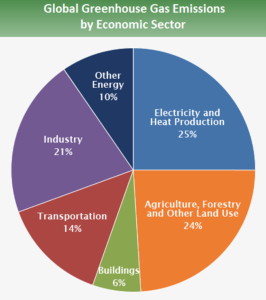
Greenhouse gas emissions have been increasing all over the world in all sectors and subsectors, with the transport and industrial sectors seeing the most significant growth. Greenhouse gas emissions from industry, buildings, and transport sectors are mostly caused by the following factors:
- Growing demand for construction materials and manufactured products
- Increasing floor area per person
- Rising building energy consumption
- Longer travel distances and larger, heavier vehicles.
Although many effects will remain permanent for thousands of years, others may be decelerated or even reversed by implementing swift, vigorous, and continuous reductions in greenhouse gas emissions.
Greenhouse Gases in Different Countries
Carbon dioxide (CO2) levels vary significantly across different countries, reflecting diverse industrial activities, energy consumption patterns, and environmental policies. With high levels of industrialization and reliance on fossil fuels, more “developed” countries generally exhibit higher CO2 emissions per capita compared to other countries. Before delving further, it’s essential to identify which countries’ economies can be described as developed, developing, emerging, and frontier.
Developed, Developing, and Emerging Countries
Economists and international business groupings rank nations by economic and industrial development. “Developed,” “developing,” and “emerging” nations are distinct groupings. Developing countries are suffering and require global trade partners, whereas emerging nations are rising fast and becoming more significant in international economy.
Developed economies have highly developed capital markets with high levels of liquidity, meaningful regulatory bodies, large market capitalization, and high levels of per capita income. Developed markets are found mostly in North America, Western Europe, and Australasia, including nations like the U.S., Canada, Germany, the U.K., Australia, New Zealand and Japan.
Developing economies are grouped together based on poor HDI and low economic growth. Examples include Bangladesh, Myanmar, Haiti, Angola, Chad, Madagascar, and 29 others. They have lower living standards, strong population growth, undeveloped industry, and economic sustainability from agriculture and exports characterize them. WTO assistance and consideration are available to these nations.
Emerging economies have companies known for being global leaders on the stock market. Due to their recent growth, some economists argue that “emerging markets” is an outdated term. Among the biggest growing economies are Brazil, Russia, India and China. Therefore, people often refer to emerging economies using the acronym “BRIC.” More examples include the PIIGS (Portugal, Ireland, Italy, Greece, Spain – also known by the more politically correct moniker GIPSI).
Frontier economies are even more emergent subsets. Some frontier markets are developing markets, but not all developing markets are frontier ones. Frontier markets have minimal market liquidity, weakly developed capital markets, and lower per capita incomes than Brazil and China. Because frontier economies have little economic development, high-risk investors are drawn to their potential for quick growth and huge rewards. Colombia, Indonesia, Vietnam, Egypt, Turkey, and South Africa are frontier markets, as are Nigeria, Bangladesh, and Botswana. The distinction between a classic developing market and a frontier market, like developed and emerging markets, depends on the entity making the distinction. Some consider Colombia a frontier market, while others an emerging market.[13]
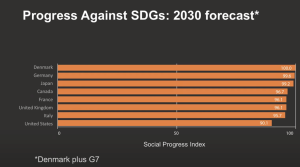
On the social progress index, the US falls behind other “developed” countries. Below the chart shows that Denmark has 100/100, close to 100 is Germany, then below is Japan at 99.2, Canada at 96.7, France at 96.1, UK at 96.1, Italy at 95.7, and the US at 90.1.
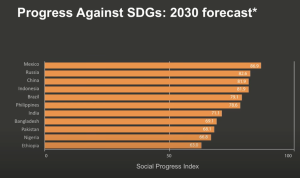
Below is a forecast on progress against SDGs in 2030 using the Social Progress Index. Mexico is on top with 86.9, then Russia with 82.6, China with 81.9, Indonesia with 81.9, Brazil with 79.1, Philippines with 78.6, India with 71.1, Bangladesh with 69.1, Pakistan with 68.1, Nigeria with 66.8, and Ethiopia with 63.0.
Conversely, many developing nations, while contributing less to global CO2 emissions per capita, are experiencing rapid industrial growth that threatens to increase their future emissions. Additionally, countries with robust environmental regulations and commitments to renewable energy sources tend to have lower CO2 levels, highlighting the critical role of policy and innovation in managing and mitigating greenhouse gas emissions. Understanding these variations is crucial for developing targeted strategies to address global climate change effectively. Below is a pie chart of CO2 emissions broken up by country. “Other” is 30%, China is 30%, United States is 15%, EU-28 is 9%, India is 7%, Russia Federation is 5%, and Japan is 4%: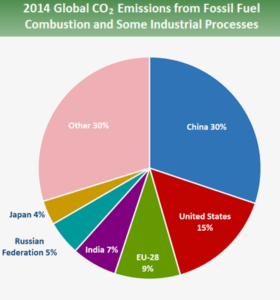
Climate Change is a National Security Threat
The security implications of global warming will be evident in several ways, including resource scarcity, food shortages, severe weather events, water insecurity, and rising sea levels, all of which will pose risks to communities worldwide. Individual action is not sufficient; governments and businesses must take action, via both emission reduction and enhancing resilience. If not, every other security obstacle in the 21st century will be almost unattainable. [16]
Global patterns of inequality are closely linked to climate change. Individuals who are the most impoverished and susceptible face the primary burdens, even though they make the smallest contribution to global warming. As climate change intensifies, many vulnerable individuals confront disproportionate difficulties concerning severe occurrences, water, health consequences, sustenance, migration and coerced relocation, livelihood stability, erosion of cultural identity, and other associated hazards. [17]
It seems that the world’s wealthiest nations, largest corporations, and most privileged people are largely responsible for a crisis that disproportionately impacts people of color, frontline communities, and the Southern Hemisphere. Climate change is more than an environmental crisis – it is a social crisis and compels us to address issues of inequality on many levels: between wealthy and poor countries; between rich and poor within countries; between men and women, and between generations. [18] For example, policies that expand public transport or carbon pricing may lead to higher public transport fares which can disproportionately impact poorer households. Similarly, if not designed in collaboration with beneficiaries and affected communities, approaches such as limiting forestry activities to certain times of the year could adversely impact indigenous communities that depend on forests year-round for their livelihoods.
Why Some Countries’ Governments Require Businesses to Report Sustainability and Some Don’t
Climate change is a global emergency that goes beyond national borders. One country’s greenhouse gas emissions do not only impact that one country but the planet. It is an issue that requires international cooperation and coordinated solutions at all levels. On December 12, 2015, global leaders at the UN Climate Change Conference (COP21) in Paris signed the Paris Agreement to combat climate change. Every country has promised to lower emissions and adapt to climate change; the Agreement helps countries to strengthen these promises. The Agreement creates a structure for open monitoring and reporting of climate goals and lets advanced nations assist less developed countries in mitigating and adjusting for climate change.
The Paris Agreement creates a decades-long worldwide framework to start a net-zero emissions transition and achieve the Sustainable Development Goals. It went into effect November 4, 2016 and includes 193 countries as well as the EU.
Every five years, nations must update their Nationally Determined Contribution (NDC) climate action plans, thereby defining their greenhouse gas emission reduction strategies in order to achieve goals of the Paris Agreement. Nations also have to outline their efforts at resilience to fit rising NDC temperatures. Unlike NDCs, the Paris Agreement asks states for long-term plans to properly specify long-term efforts, although they are optional. [19]
Views on Climate Change in Different Countries
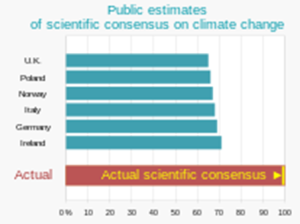
According to a 2022 survey, the public significantly undervalues the degree of scientific agreement over the cause of climate change. Research during 2019–2021 revealed scientific agreement to run between 98.7–100%.
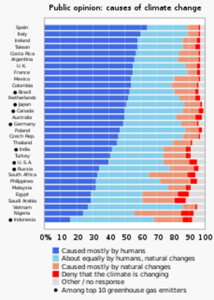
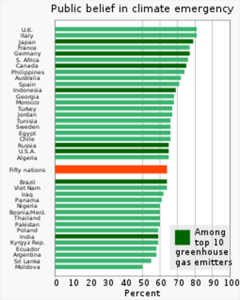
The United Nations Development Program survey above displays beliefs about whether climate change or not a climate emergency. The top shows the countries who mostly believe climate change is caused by humans, then goes down to less certain. Spain is the top, then Italy. The next three countries are similarly tied: Ireland, Taiwan, Costa Rica. The bottom country is Indonesia, second from bottom is Nigeria, then third from bottom is Vietnam. Some countries have circles next to their names to indicate they are among the top ten greenhouse gas emitters. They are among the bottom to the middle in this order from bottom to middle: Indonesia, Russia, USA, India, Germany, Canada, Japan, and Brazil.
Views of Global Warming in the USA
Many European countries’ governments can successfully mandate business practices to be more environmentally friendly, however, the US is falling behind. Despite the alarming trends described in the beginning of this chapter, American people are not very interested in global warming:
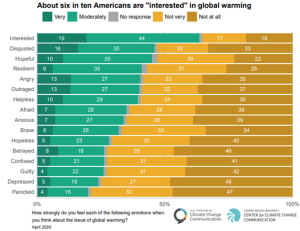
The above chart says “about six in ten Americans are “interested in global warming.” It has a list of emotions from top to bottom with “very” on top and “not at all” on the bottom. The top three include “interested,” “disgusted,” “hopeful,” at 19%, 16%, and 10%, respectfully. Then the bottom three are “panicked,” “guilty,” and “depressed” at 4%, 4%, and 5% respectfully.
Americans are interested in the actions taken by political leaders and businesses, as shown in the bottom chart:
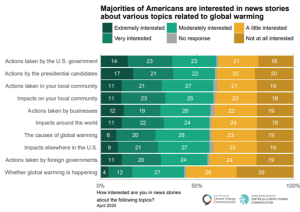
This chart is titled “Majorities of Americans are interested in news stories about various topics related to global warming.” The top “extremely interested” responses are “actions taken by the presidential candidates,” “actions taken by the U.S. government,” and “actions taken by businesses,” at 17%, 14%, and 12%, respectfully.
However, seven in ten even think global warming is happening, as shown in the chart below:
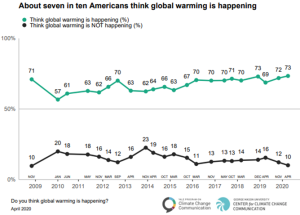
This chart shows two lines, green is for those who think global warming is happening (in percentage) and black for those who do not think global warming is happening (in percentage). From 2009-2020, the green line started at 71%, went down in 2010 at 57%, then stayed between 61-73% since, ending at 73% in 2020. The blank line started at 10% in 2009, went up to 20% in 2010, then down to 12% in 2013, up to 23% in 2014, down to 11% in 2016, up to 16% in 2019, then down to 10% again in 2020.
Only six in ten feel well informed about global warming and two in three feel a personal sense of responsibility to help reduce global warming.[23]
American Psychological Association shows that although more than half of U.S. adults (56%) say climate change is the most important issue confronting society today, 4 in 10 have not changed their behavior to help to lower their contribution to climate change as the effects of climate change become more clear-cut. While 7 in 10 say they wish there were more they could do to address climate change, 51% of U.S. adults say they have no idea where to begin.[24]
Although this section focused specifically on the USA, the main idea is that even within one country, individuals communicate about the environment differently, so it is clear why it is challenging for businesses to stress what they are doing to lessen their impact on the environment, whether their audiences are in the USA or elsewhere.
Communicating about Global Warming Positively
Although global warming sounds alarming, we can approach learning about it with a hopeful attitude knowing that small actions can inspire positive change—especially in businesses, which are organizations of people that drive international economies. Some studies can help see the future with more optimism
While headlines about climate-related disasters have grown, U.S. greenhouse gas emissions dropped by 17 percent from 2005 to 2021 while the size of the economy doubled. Solar and wind costs have plummeted by 70 percent and 90 percent over the most recent decade and account for 80 percent of new electricity generating capacity in 2023. Domestic sales of electric vehicles are also surging, with over 1 million vehicles sold so far in 2023 — up 50 percent from 2022 and representing one in 10 new vehicles sold. [25]
The decline in clean energy expenses and the implementation of supplementary climate regulations in the United States and other countries have contributed to a decrease in the projected global warming for this century. The expected temperature rise has been reduced from 3.5 degrees Celsius to 2.4 degrees Celsius, partially due to the increased affordability of climate mitigation measures worldwide. The life cycle costs associated with solar and wind energy are now lower than those of coal, gas, and nuclear energy. This indicates substantial progress, but nations are still not on course to achieve the objective of the Paris Agreement, which is to restrict global warming to below 2 degrees Celsius, and they are also failing to fulfill their individual targets. [26]
The future of our climate is in our hands: we are living in an era where we are aware of the seriousness of the issues of global warming and have the opportunity to take action. We can collectively take efforts aimed at diminishing emissions, fortifying resilience, fostering adaptation, and promoting fairness. However, individuals must confront their climate change-related anxieties in order to redirect their attention towards cultivating hope.
Climate Anxiety
Climate anxiety, also known as eco-anxiety, is the upsetting experience connected to the effects of climate change. This kind of suffering results from uncertainty, loss of control, and worries about safety or well-being. Unlike many personal stresses, climate change may be more widespread, persistent, and frequently invisible. This makes climate anxiety capable of affecting a lot more people. [27]
Learning how to manage climate anxiety will help us to avoid burnout or tiredness; stay involved in climate action; sit with our emotions and the challenges facing us; avoid letting our feelings overwhelm us; keep on functioning and find delight in our daily life; and sow hope for the future.
Strategies to manage climate anxiety:
[1] https://science.nasa.gov/climate-change/what-is-climate-change/
[2] Greenhouse effect | Definition, Diagram, Causes, & Facts. (2024, May 31). Encyclopedia Britannica. https://www.britannica.com/science/greenhouse-effect and https://www.britannica.com/question/How-does-global-warming-work
[3] Mann, M. E. (2024, July 9). Global warming | Definition, Causes, Effects, Solutions, & Facts. Encyclopedia Britannica. https://www.britannica.com/science/global-warming/Climatic-variation-since-the-last-glaciation
[4] Fossil. (n.d.). U.S. Department of Energy. From https://www.energy.gov/fossil
[5] Global Greenhouse Gas Overview | US EPA. (2024, April 11). US EPA. https://www.epa.gov/ghgemissions/global-greenhouse-gas-overview
[6] Friedlingstein, P., O’Sullivan, M., Jones, M. W., Andrew, R. M., Bakker, D. C. E., Hauck, J., Landschützer, P., Quéré, C. L., Luijkx, I. T., Peters, G. P., Peters, W., Pongratz, J., Schwingshackl, C., Sitch, S., Canadell, J. G., Ciais, P., Jackson, R. B., Alin, S. R., Anthoni, P., . . . Smallman, T. L. (2023). Global Carbon Budget 2023. Earth System Science Data, 15(12), 5301–5369. https://doi.org/10.5194/essd-15-5301-2023
[7] IPCC, 2007: Climate Change 2007: The Physical Science Basis. Contribution of Working Group I to the Fourth Assessment Report of the Intergovernmental Panel on Climate Change [Solomon, S., D. Qin, M. Manning, Z. Chen, M. Marquis, K.B. Averyt, M.Tignor and H.L. Miller (eds.)]. Cambridge University Press, Cambridge, United Kingdom and New York, NY, USA.
[8] Global Greenhouse Gas Overview | US EPA. (2024, April 11). US EPA. https://www.epa.gov/ghgemissions/global-greenhouse-gas-overview
[9] Nielson, L. (2011). Classifications of Countries Based on Their Level of Development: How it is Done and How it Could be Done. IMF Working Paper. https://www.imf.org/external/pubs/ft/wp/2011/wp1131.pdf
[10] Investment Fundamentals: Developed markets | SEI. (n.d.). SEI. https://www.seic.com/investment-fundamentals-developed-markets
[11] Least Developed Countries (LDCs) | Department of Economic and Social Affairs. (n.d.). https://www.un.org/development/desa/dpad/least-developed-country-category.html
[12] Difference Between Developing Countries & Emerging Countries. (2021, November 20). Bizfluent. https://bizfluent.com/info-10002682-difference-between-developing-countries-emerging-countries.html
[13] What is the difference between a developed, emerging, and frontier market? (2012, May 11). Nasdaq. https://www.nasdaq.com/articles/what-difference-between-developed-emerging-and-frontier-market-2012-05-11
[14] https://www.youtube.com/watch?v=N3SQlrmV1cE
[15] Social Progress Imperative. (n.d.). Social Progress Imperative. https://www.socialprogress.org/
[16] Five ways the climate crisis impacts human security | United Nations. (n.d.). United Nations. https://www.un.org/en/climatechange/science/climate-issues/human-security
[17] Social Dimensions of Climate Change. (n.d.). World Bank. https://www.worldbank.org/en/topic/social-dimensions-of-climate-change#:~:text=As%20the%20climate%20continues%20to,identity%2C%20and%20other%20related%20risks.
[18] McCarthy, J. (2021, April 20). Why Is Climate Change a Racial Justice Issue? Global Citizen. https://www.globalcitizen.org/en/content/why-is-climate-change-a-racial-justice-issue/
[19] Kopp, R. (n.d.). Profound changes are underway in Earth’s oceans and ice, a new IPCC climate report warns – one of the authors explains what the warnings mean. Encyclopedia Britannica. https://www.britannica.com/story/ipcc-climate-report-says-profound-changes-are-underway–a-lead-author-explains
[20] Xifra, J. (2016). Climate Change Deniers and Advocacy: A Situational Theory of Publics Approach. American Behavioral Scientist. 60 (3): 276–287.
[21] Leiserowitz, A.; Carman, J.; Buttermore, N.; Wang, X.; et al. (June 2021). International Public Opinion on Climate Change (PDF). New Haven, CT: Yale Program on Climate Change Communication and Facebook Data for Good. p. 7. Archived (PDF) from the original on 28 June 2021.
[22] Survey results from: “The Peoples’ Climate Vote”. UNDP.org. United Nations Development Programme. 26 January 2021. Archived from the original on 28 January 2021. Fig. 3.
Data re top emitters from: “Historical GHG Emissions / Global Historical Emissions”. ClimateWatchData.org. Climate Watch. 2021. Archived from the original on 21 May 2021.
[23] Climate Change in the American Mind: November 2019 – Yale Program on Climate Change Communication. (2024, June 29). Yale Program on Climate Change Communication. https://climatecommunication.yale.edu/publications/climate-change-in-the-american-mind-november-2019/toc/3/
[24] Bethune, S. (2020). Majority of US Adults Believe Climate Change Is Most Important Issue Today. American Psychological Association. https://www.apa.org/news/press/releases/2020/02/climate-change
[25] Hawkins, A. J. (2023, November 1). The EV transition trips over its own cord. The Verge. https://www.theverge.com/23934889/electric-vehicle-ev-transition-sales-delays-politics
[26] The energy world is set to change significantly by 2030, based on today’s policy settings alone – News – IEA. (2023, October 24). IEA. https://www.iea.org/news/the-energy-world-is-set-to-change-significantly-by-2030-based-on-today-s-policy-settings-alone
[27] 6 tips for coping with climate anxiety. (2024, May 31). Health & Wellness Services. https://www.colorado.edu/health/blog/climate-anxiety#:~:text=Climate%20change%20can%20elicit%20emotions,to%20future%20or%20existential%20threats.
[28] Seven Ways to Feel Hopeful About Climate Change. (n.d.). Greater Good. https://greatergood.berkeley.edu/article/item/seven_ways_to_feel_hopeful_about_climate_change#:~:text=Celidwen%20spoke%20deeply%20about%20how,we%20are%20part%20of%20her. More about Dr. Celidwin at https://www.yuriacelidwen.com/
[29] Happiness Break: How to Be in Harmony in Nature—Wherever You Are, With Yuria Celidwen. (n.d.). Greater Good. https://greatergood.berkeley.edu/podcasts/item/belonging_to_the_earth_with_yuria_celidwen